Are solar and lunar cycles esoteric nonsense, or do they provide a real edge in the trading world? This is the same question I set out to answer, so I built a tool that tracks these cycles and aligns them with asset prices – the result?
The History of Lunar Cycles
Throughout history, market participants have searched for patterns that might reveal the hidden rhythms of price movements – and in fact, I think most schools of thought have been leveraged in an attempt to find alpha. Among the most intriguing of these are the correlations between celestial cycles, particularly those of the Moon and the Sun, and the behaviour the financial markets exhibit during certain stages in these solar and lunar cycles. While such ideas can appear esoteric at first glance, there is a long tradition of traders and researchers observing that turning points in asset prices often coincide with lunar cycles, eclipses, or solar events. The notion is not that planets or stars directly influence prices, but rather that cyclical natural phenomena might mirror the psychological and emotional waves that govern human decision-making, and thus the markets.
Millionaires don’t use astrology, billionaires do.
The Lunar Cycle
The lunar cycle, lasting roughly 29.5 days, has long been associated with patterns of human emotion and behaviour. Traders attuned to this rhythm note that new moons and full moons often mark periods of intensified sentiment—moments, when fear or exuberance reach temporary extremes. In many markets, from equities and currencies, to commodities and even cryptocurrencies, there have been observed tendencies for reversals or accelerations near these lunar turning points. Some studies have suggested that stock returns are marginally higher in the days around a new moon, a time symbolically associated with renewal and fresh starts, while volatility tends to rise near the full moon, a phase historically linked with heightened activity and emotion. Though the statistical strength of these effects remains understandably debated, their persistence across decades suggests that lunar timing may reflect subtle, yet fundamental behavioural undercurrents in trading.
Solar cycles operate on a broader and slower timescale than lunar cycles. The Sun’s activity, measured through its 11-year cycle of sunspots and solar flares, has been connected to fluctuations in both global climate and human mood. In financial contexts, some researchers have proposed that periods of higher solar activity, characterized by greater electromagnetic disturbance, may subtly influence investor psychology, risk tolerance, and even technological systems that underpin modern trading networks. Sound outlandish? Well, historically, certain bull and bear market phases have appeared to align with solar maxima and minima, as if the energetic pulse of the Sun were loosely synchronized with collective economic optimism or caution. These relationships are not deterministic, but they offer a symbolic framework for understanding how large-scale natural cycles can coincide with human economic behaviour.
Solar and Lunar Cycles and Emotions
When lunar and solar influences intersect, during eclipses, for instance, their combined significance often captures the imagination of cyclical analysts. Eclipses represent moments of alignment and transition, both astronomically and metaphorically. In market terms, they can coincide with inflection points – periods when trends either reverse sharply or continue with renewed strength after a temporary consolidation. Such events seem to amplify the emotional charge of the market environment, prompting sudden shifts in perception that manifest as breakouts, sell-offs, or volatility spikes. While these patterns cannot be relied upon as precise timing tools, they serve as reminders of how collective psychology, driven by natural cycles of attention and sentiment, can synchronize across participants – and when combined with other studies such as supply and demand, this is when a visible alpha appears.
Lunar Cycles and Celestial Patterns
Ultimately, the study of solar and lunar cycles in relation to asset prices reflects a broader human desire to find order within apparent randomness. Markets, like the cosmos, move through rhythms of expansion and contraction, brightness and shadow. Whether through statistical causation or symbolic resonance, these celestial patterns offer a language for describing the ebb and flow of market emotion. Traders who observe them with an open but disciplined mind may find not certainty, but perspective, and a reminder that cycles, both earthly and cosmic, often guide the unseen tides of collective energies and behaviour that shape the rise and fall of prices.
I wanted to see for myself
So I started working on a tool, which I published today, to help us understand how the aforementioned cycles align with assets prices, and there seems to be an observable edge. But why would lunar cycles have an effect on asset prices? I don’t know, but I have a couple of ideas.
Lunar phases influence human mood and behaviour. Some psychological and biological studies support the idea that the lunar cycle can affect sleep patterns, mood, and consequently, judgment.
Mood affects financial decisions. In the context of behavioural finance, shifts in collective investor mood, influenced by the moon, could subtly affect buying and selling decisions, creating a predictable pattern in returns. For example, a more optimistic mood around the New Moon could lead to a buying bias and higher prices/returns.
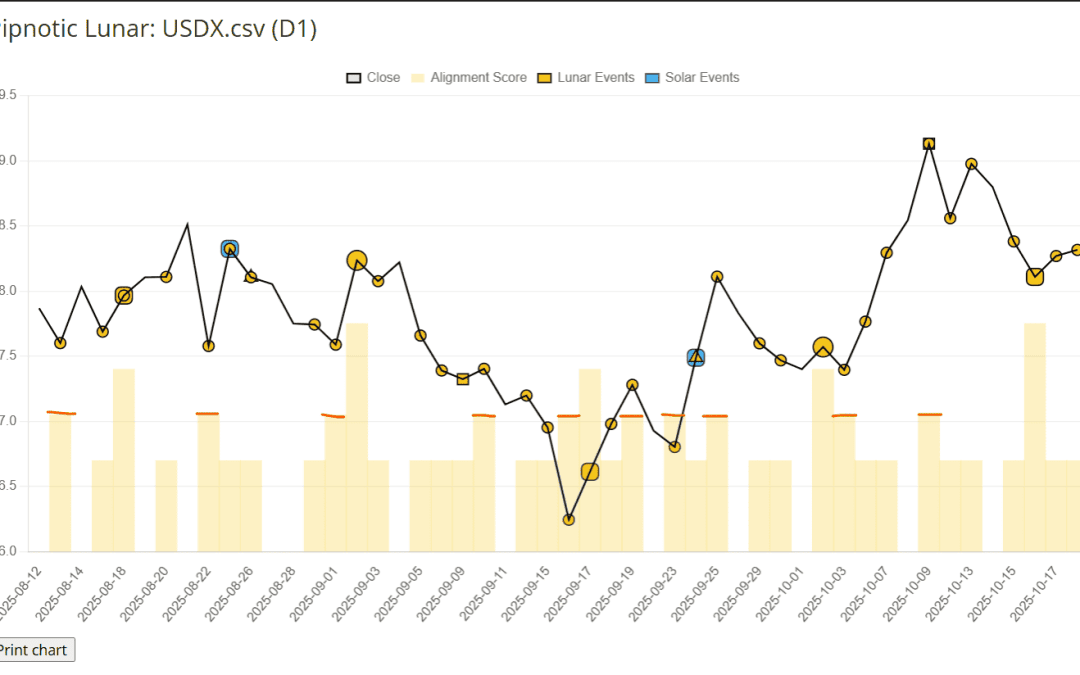
In the following screenshots, when the histogram reaches approximately 30 (marked with an orange line), assets prices turn, almost every time. This is remarkable, as the dates are known beforehand, so this becomes a leading signal.
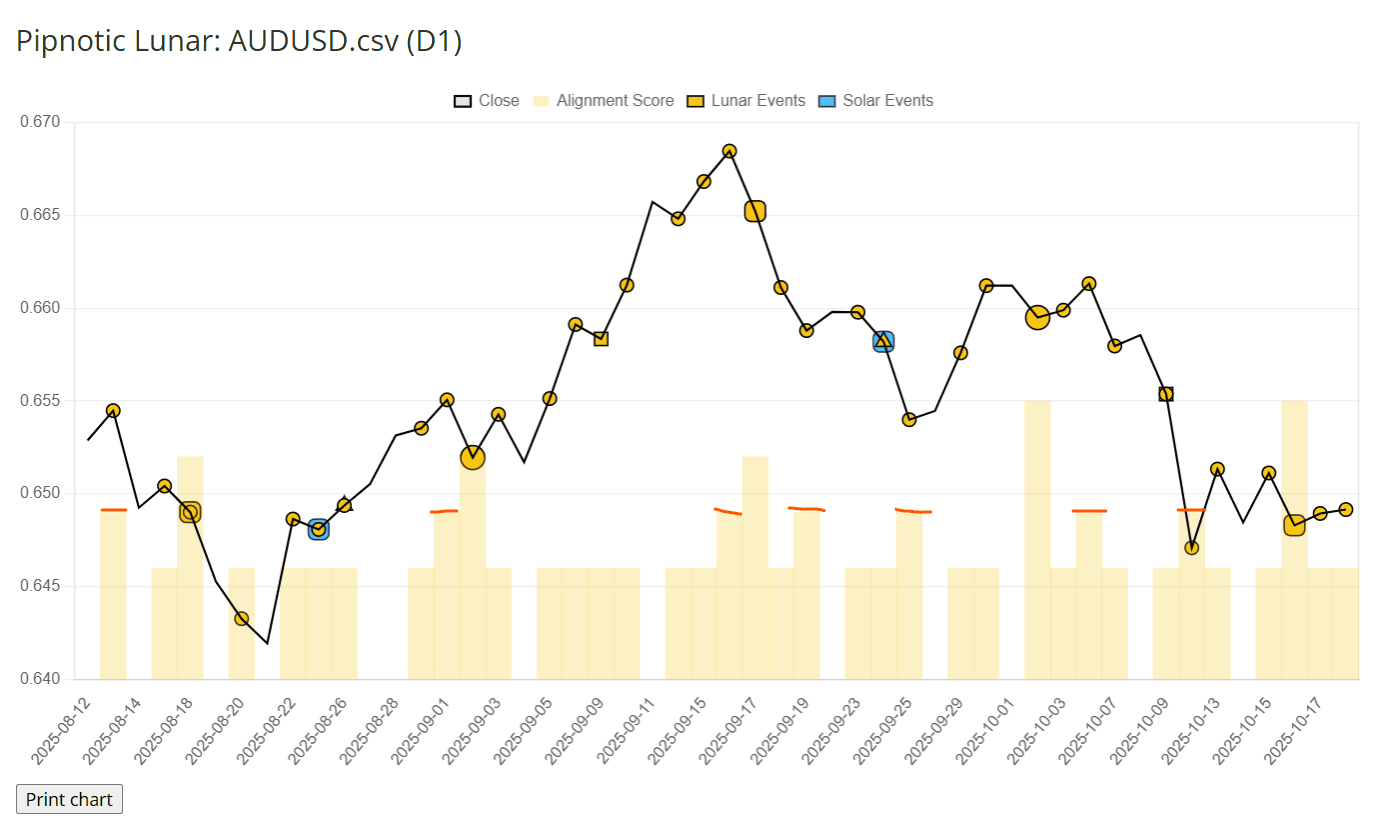
It is undeniable that when the histogram reaches these levels that prices turn, and this seems to be happening almost every time, which is rather fascinating. Let’s have a look at an example on the USD index.

What is it that causes prices to turn there? I don’t know, but what I do know is that we can track this information in real time and predict when the level 30 will be reached again in the future.

I’ll stop myself here, as I could go on and on about this fascinating topic. I am also working on another tool that analyses prices and times, and illustrates how prices also seem to turn when these dates/times have a digital root equal to a number that resembles the given assets’ vibration. I know how this sounds, and no I am not wearing a beaded necklace, nor am I floating while I type these words, but believe me that when I say that prices do indeed turn on certain dates and at certain times – once again, for reasons I don’t really understand. It seems here that each asset has its own rhythm or vibration, at least this is my observation. I will send out an update on this as the dashboard nears completion.
If you have any questions, please don’t hesitate to shoot me a message.
Thank you.