In trading, success doesn’t come from following tips or copying someone else’s setup, it comes from understanding why a trading strategy works and how it fits into the markets you trade. Many traders have great intuitions or behaviour recognition, but lack the structure to turn those ideas into robust, testable strategies. This article walks you through the full process of building a trading strategy, from the spark of an idea to a validated edge, using a practical example and tools you can apply.
The Initial Spark: Observing the Market
Every trading strategy begins with a hunch, a hypothesis about how price tends to behave under certain conditions. It might come from hours of screen time, a pattern you notice recurring, an insight from studying charts or order flow, or something you heard someone talk about.
An example hypothesis might be something like:
Price often reverses after a sharp breakout followed by a period of tight consolidation. It looks like buyers run out of steam, and the market pulls back.
This is the seed. It might not be statistically valid yet, but it’s a valuable observation. The next step is to turn this into something the market, or a computer, can actually understand and execute in such a way that it is possible to test and adjust the different variables of the trading strategy.
Structuring the Idea into Rules
For a trading strategy or idea to be testable, it needs to be translated into objective criteria. We want to move from vague feelings to precise logic, as this logic is what will be required in order to actually make decisions in order to execute trades.
Let’s turn the above hypothesis into some concrete logic:
Trigger candle: A bullish candle closes at least 2x the ATR(14) above the previous close (indicating a price spike).
Consolidation phase: Next 3 candles all have a range less than 25% of the trigger candle’s range (indicating loss of momentum).
Entry: Enter short if the next candle breaks the low of the tight consolidation range.
Stop-loss: Above the high of the tight range.
Target: 2x the risk (risk-reward ratio of 1:2), or mean reversion to the 20-period moving average.
You can enhance it further by adding optional filters:
- Only trade between specific market hours (e.g., London or New York session).
- Trade GBPUSD only
- Avoid trading right before major economic news events.
- Only trade at lunchtime GMT as traders leave their desks for lunch, causing a 20-40 minute pullback
Implementing the Trading Strategy Logic
Once your entry, exit, and risk management rules are clearly defined, the next step is to translate those rules into an actionable format – in other words, to implement the logic of your trading strategy in a way that allows it to be tested and eventually executed. There are several common approaches, depending on your goals and level of technical expertise:
Back Testing Platforms and Tools: Platforms like the Pipnotic Strategies Tester streamline this process. Instead of writing code, you define your strategy inputs in the interface, and the engine handles the execution logic against either real historical data or synthetic simulations. This is ideal for traders who want speed, visual clarity, and ease of comparison across strategies, instruments, or timeframes.
Manual Implementation: For those just starting out or testing a simple concept, strategy logic can be applied manually using charting platforms. You observe the signals and log trades by hand, perhaps using a journal or spreadsheet. This method is time-consuming and prone to human error but helps traders internalize patterns and develop intuition.
Spreadsheet-Based Models: Tools like Excel or Google Sheets are popular among traders who prefer a visual, hands-on method without coding. You can input historical price data and use formulas to simulate strategy logic – such as moving average crossovers, RSI thresholds, or trailing stops. While limited in complexity and speed, spreadsheets are a useful way to prototype a strategy before moving on to more automated systems.
Programming Languages (e.g., Python): For more serious testing and automation, implementing strategy logic in a language like Python gives you far greater control and flexibility. With libraries like pandas for data handling, numpy for calculations, and backtrader or vectorbt for testing frameworks, you can model intricate strategies that involve multiple indicators, position sizing rules, and dynamic risk management. You can even connect to APIs for real-time data and execution.
Back Testing with Real Market Data
Back testing is where ideas meet reality. First, run the trading strategy on real historical market data across multiple instruments and timeframes.
You’re looking for:
- Overall profitability
- Average win/loss
- Drawdown and recovery
- Trading strategy robustness
Make sure the data includes a wide range of conditions such as volatile spikes, consolidations, trends, range-bound markets. This gives you a clearer picture of how the trading strategy performs beyond cherry-picked examples. This is why I like to use synthetic data for some of the testing, as if it is possible to build something that does well using highly unpredictable data, then you’re off to a good start.
Testing with Synthetic Data
While real data tells you how a trading strategy would have performed, it may not include rare events or outliers. This is where synthetic data comes in, it allows you to simulate:
- High-volatility clusters
- Trending vs. mean-reverting regimes
- Noise-heavy environments
- Flash crash-type movements
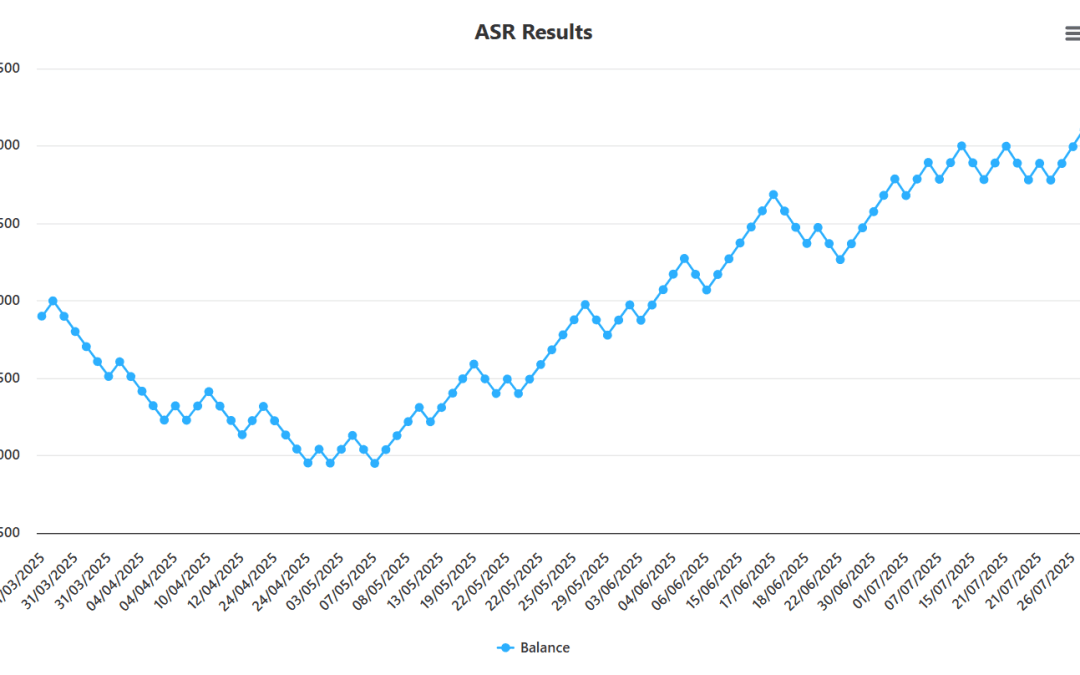
Using a back tester or a trade simulator, you can stress-test your logic under extreme but plausible scenarios, helping uncover weaknesses before they show up in live trading. Here is an example of the ASR running on synthetic data:

Analysing and Refining
After testing, you’ll have a trove of metrics and performance insights for your trading strategy. Don’t just look at win rate, also study:
- Reward-to-risk ratio
- Average time in trade
- Slippage or spread sensitivity
- Strategy behaviour during news or macro shifts
Adjust rules only if the change is logical but avoid overfitting. If a small tweak makes results drastically better on one instrument but worse elsewhere, that’s a red flag.
Forward Testing or Paper Trading
Before going live, run the trading strategy in real-time on a demo account. This reveals practical issues:
- Are entries missed due to execution delays?
- Do you over trade or hesitate emotionally?
- Does your logic hold in fast-moving markets?
Use this time to build confidence and refine operational flow without risking capital.
Going Live (Small and Controlled)
Once the trading strategy is ready, start trading with minimal risk. Track the performance of live trades compared to historical results.
Ask questions like:
- Are the live results consistent with back test expectations?
- Is the trading strategy behaving predictably under new conditions?
- Is anything unexpected occurring (e.g., platform slippage, emotional execution issues)?
Adapt slowly as your edge needs time to prove itself in real conditions. Remember to take it slow when changing parameters, or you’ll have a tough time keeping track of which changes are causing the results to change.
Strategies Aren’t Found, They’re Built
Building a successful trading strategy isn’t luck or magic, it’s a structured, iterative process. You begin with a spark of insight, refine it into rules, and put it through rigorous testing before ever placing a trade.
At Pipnotic, we’re helping traders make that journey easier by combining powerful tools like ASR and BASZ (to detect market behaviour), synthetic testing (to explore extreme conditions), and now a fully split architecture with a deep learning back end and a browser-based front end for filtering high-quality trades.
The goal is to give you not just tools, but clarity, the kind that leads to real conviction in the markets.