Nobody likes to lose, I get it, as it means that you were wrong and nobody likes to be wrong. But what if I told you that even if you were wrong, you could still be incredibly profitable. Would that change how you felt about losing in trading and about trading algorithms that did? What I am about to show you will do just that. It turns everything upside-down and provides support even after losing 16 trades in a row. What do I mean? Let’s have a closer look.
Developing Trading Algorithms
As many of you know, I’ve been immersed in the fascinating world of developing trading algorithms for a very long time now. It’s a journey that, for me, holds an almost magical allure – I truly love the process of building and refining these intricate trading algorithms, often even more than the satisfaction of the final outcome. There’s an exhilarating challenge in striving to one day “solve the market,” a goal I confidently believe I’ll achieve. Until that day arrives, I’m committed to savouring every step of this ongoing, delicious adventure and, of course, sharing my progress and discoveries with all of you.
Trading is a Game of Probabilities and Maths
At the core of my convictions, I truly believe that the intricacies of the markets can be best deciphered through the lens of simple mathematics. And I emphasize “simple” because I’m not some mathematical prodigy – and in fact, mathematical fluency was actually something that successfully eluded me throughout my entire time sitting in classrooms. My intuition tells me that asset prices, much like everything else in the cosmos, adhere to universal laws of movement – patterns that, with the right approach, can be understood using these very basic mathematical principles by applying them to trading algorithms. It’s akin to cycles in nature, as prices expand, whether soaring upwards or plummeting downwards, there’s almost always an inherent tendency for them to slow down and ultimately return to value. This cyclical nature is a fundamental truth of the universe as well, it’s a continuous ebb and flow where “what goes up must come down.”
Don’t Be Fooled
However, life (and markets) rarely follow a perfectly predictable script. When asset prices decide to take their time returning to value, perhaps lingering longer than expected, this is precisely when the time and effort invested in robust risk mitigation become paramount to success. It’s a critical distinction, as merely hoping things will revert to the mean, or assuming they will “soon,” is a dangerous gamble. As risk managers, it’s our undeniable responsibility to actively manage for those scenarios where the unexpected occurs, where the market deviates from the expected path, whatever that deviation may be, and build mitigation procedures into our trading algorithms we employ. We can’t afford to be caught off guard, we must be prepared for what might happen, not just what we wish would happen.
Real Simulations Reveal Patterns
I had a dream while on holiday in Australia with my family early this year. I woke up and scribbled notes relating to trading algorithms in my notebook and went back to sleep. When I woke up, I said to my wife that I needed a few hours to do something. After breakfast, I went to work. I built a super simple (that word again) trade simulator that enabled me to test probabilities and apply them to trading. The idea was to see if super low winrates (R-ratios) in trading algorithms could be leveraged to build a very profitable trading system – and if so, what would the underlying conditions and parameters have to be in order for this to be so. Three hours later, I was finished and began running some simulations – the result you ask? Apparently, you can. Using random entries and solid risk mitigation practices, it was possible to identify sweet spots that didn’t overexaggerate the performance of trading algorithms – but instead, leveraged a higher winrate. We all want to be right most of the time, but this is simply not possible, especially when we are making decisions in an environment that is mostly random.
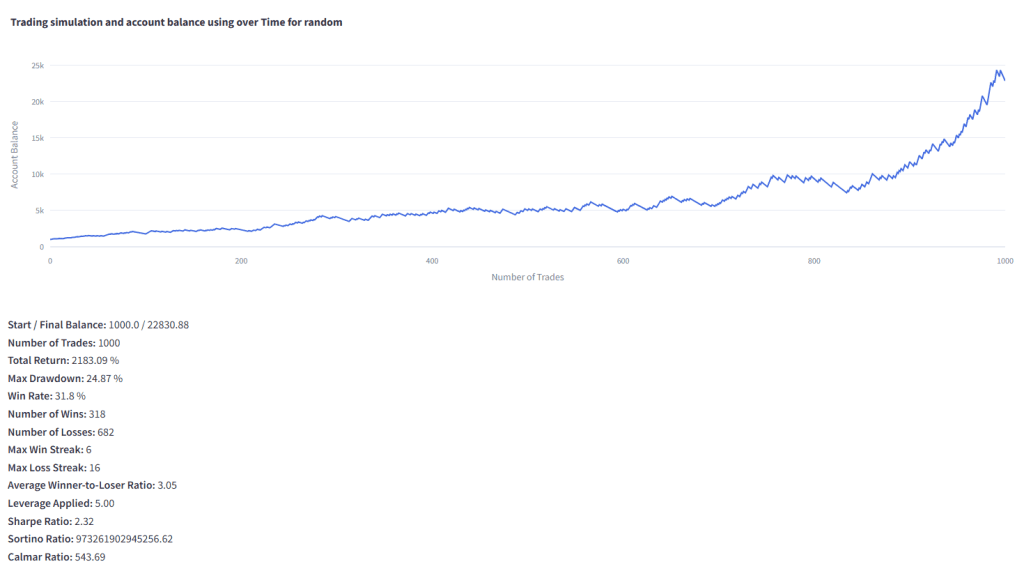
Let’s have a look at the results from this particular simulation:
The Courage to Continue
To summarize my thought experiment into a short conclusion, I will just tell you that you can build highly profitable trading algorithms even thought you are losing more than 70% of the time. The reason it is important to emphasize that the vast majority of trades end with a loss, is, because it requires that the person executing the trades must be willing to continue to trade, each time one is qualified and without questioning whether it will be a loser or a winner. In some cases, during my simulations, losing streaks reached as much as 16 losing trades in a row! What does that mean? Well, try doing something, almost anything, and doing it wrong, not only 16 times in total, but 16 times in a row! Would this have you questioning your process, strategy or process? Of course, it would – but, even after a dizzying losing streak, we must continue, as if we begin to question the process, the probabilistic model will fall to pieces and will inevitably lose. This is why we need to see it being simulated first so we know what we may face temporary defeat with confidence such that we are able to continue. It’s okay, we’ve seen this before, keep at it.
Where I am Today on My Journey
Roughly a decade ago, I embarked on a journey to construct two distinct trading algorithms, each designed to capture different facets of market behaviour. The first, which I’ve dubbed Buy and Sell Zones (BASZ), focuses intently on momentum and liquidity, aiming to identify and capitalize on sustained price movements. The second, Asset Strength Reversion (ASR), is built upon the very principle I touched upon earlier, the inherent tendency for asset prices to return to value most of the time, leveraging those cyclical market corrections – and if they don’t, which they sometimes won’t, we get out.
From Vision to Verified Performance
These trading algorithms have been running for a considerable period now, a testament to their foundational robustness. However, it’s only been in the past six months, thanks to some modifications, that they’ve truly begun to perform in line with the vision I held when I first conceived them. This breakthrough ignited a new desire: I wanted to gain a comprehensive understanding of how these trading algorithms were truly performing across a diverse range of user instances and configurations. The goal was to move beyond my own testing and see their real-world efficacy, in the markets, with real money. At the beginning of the year, I started collecting trade statistics from all instances of the BASZ Expert Advisor – and yesterday, I published them to the community.
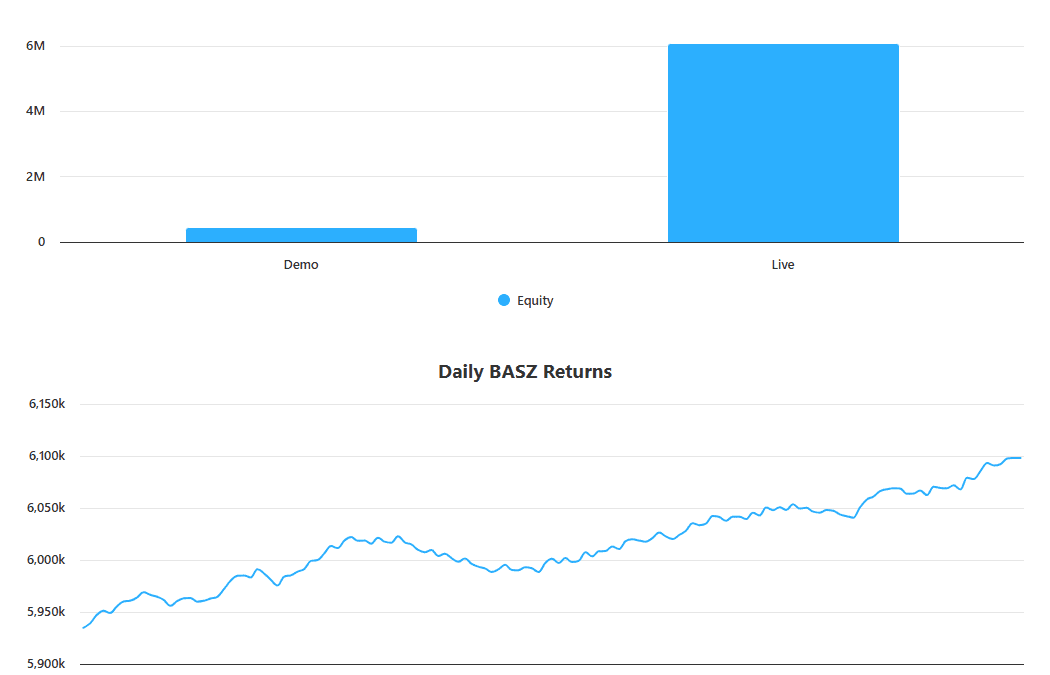
Here are the results thus far:
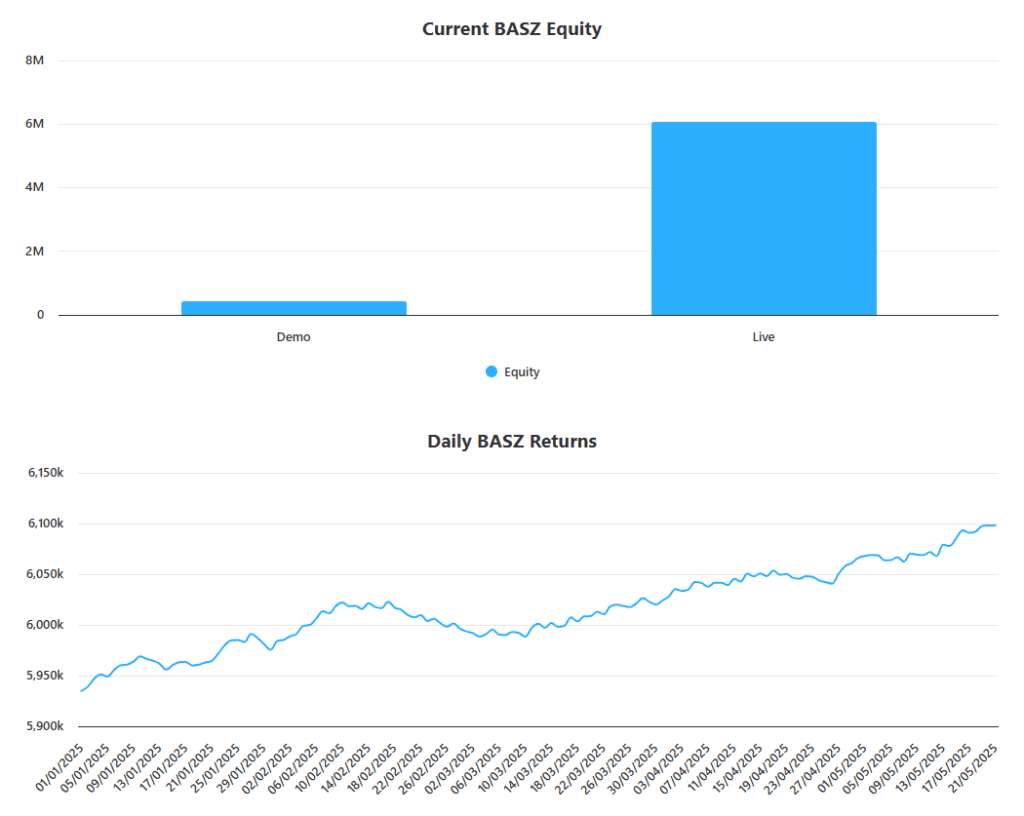
For nearly five months, I carefully collected and analysed trade data from these live applications, and after all that effort, I was able to publish the daily returns for the momentum algorithm (BASZ). Sharing this hard-won data with the community is something I’ve been eager to do, and it’s precisely what I’m thrilled to unveil to you today. Now, each day both BASZ and ASR are actively trading, data continues to tick in so that we are able to follow along and see how they are performing. I don’t have much data for the ASR, so I will still need a few more months before I can begin drawing conclusions – but so far so good.
The journey continues!