by admin | Mar 25, 2026 | Articles
There’s a moment every trader experiences, usually around 3 AM, face illuminated by the blue glow of Bloomberg terminals, double-espresso number four wearing off, when they think: There has to be a better way. Well, buckle up, because we’re about to...
by admin | Mar 21, 2026 | Articles
Game Theory Trading: How to Think Like an Institution What if trading isn’t about finding the perfect indicator, but about understanding who you’re playing against? That’s the core idea behind game theory trading, and once you see the market through this lens, you...
by admin | Feb 13, 2026 | Articles
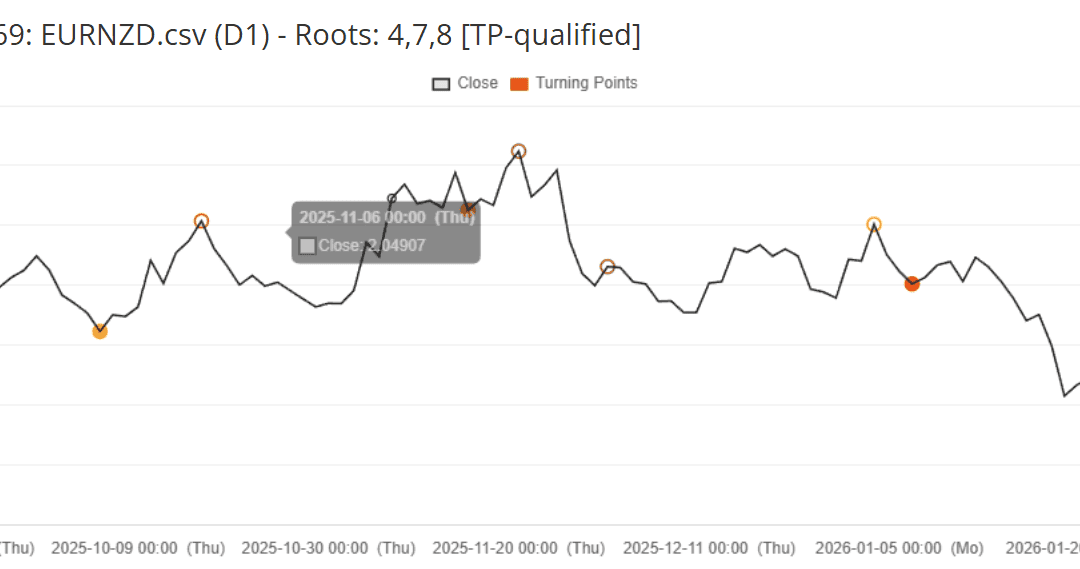
Fasten your seatbelt, as things are about to get uncomfortable. Markets obsess over price. Indicators. Oscillators. Order flow. Volume. Liquidity exploration. Everyone is staring at the what, but few are studying the when. I’ve been building...
by admin | Jan 30, 2026 | Articles
After more than a decade relegated to the “wilderness” of the investment world, nuclear energy has abruptly reclaimed its seat at the table. This is not the result of a sudden romantic shift in public opinion, but rather a cold, hard collision with...
by admin | Jan 6, 2026 | Articles
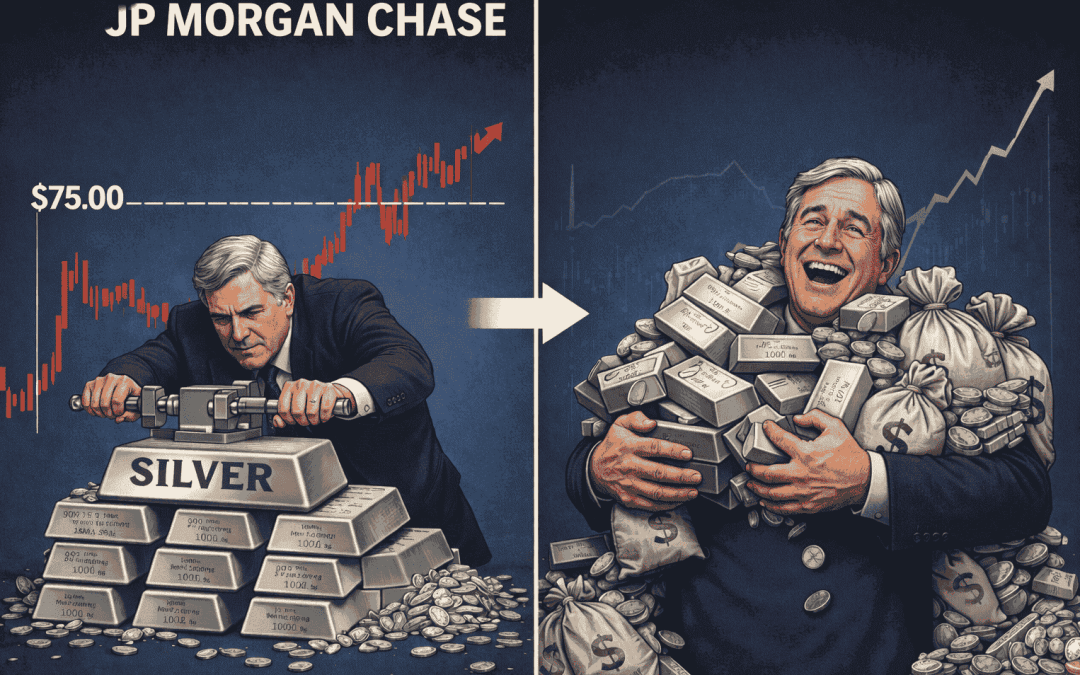
In a historic strategic reversal, JPMorgan Chase has completely closed its notorious 200-million-ounce “naked” short position, which for over a decade was accused of suppressing silver prices through paper derivatives, and pivoted to amassing a massive...
by admin | Sep 2, 2025 | Articles
Are you passionate about trading the financial markets? How would you like to build long-term income, and work remotely representing a trusted trading software brand? Pipnotic has been building trading software and education since 2011, and has built a great brand as...