At Pipnotic, we believe in data-driven clarity. Trading isn’t just about intuition or gut feel, it’s about grounding strategies in evidence, so that decisions can be made with discipline rather than impulse, in order to measure strategy performance. The markets will always be unpredictable, but by consistently measuring and analysing strategy performance, traders can replace uncertainty with informed confidence. That’s why we track our strategies relentlessly: the data tells the story, and the story keeps us honest.
The latest results from the ASR (Asset Strength Reversion) strategy provide exactly that kind of clarity. With thousands of trades executed across currencies, metals, indices, and even crypto, the strategy performance data shows both where ASR excels and where the market demands caution. It’s a comprehensive snapshot that highlights adaptability, exposes weak spots, and gives traders a realistic foundation to build upon. Let’s look at the numbers.
The Big Picture
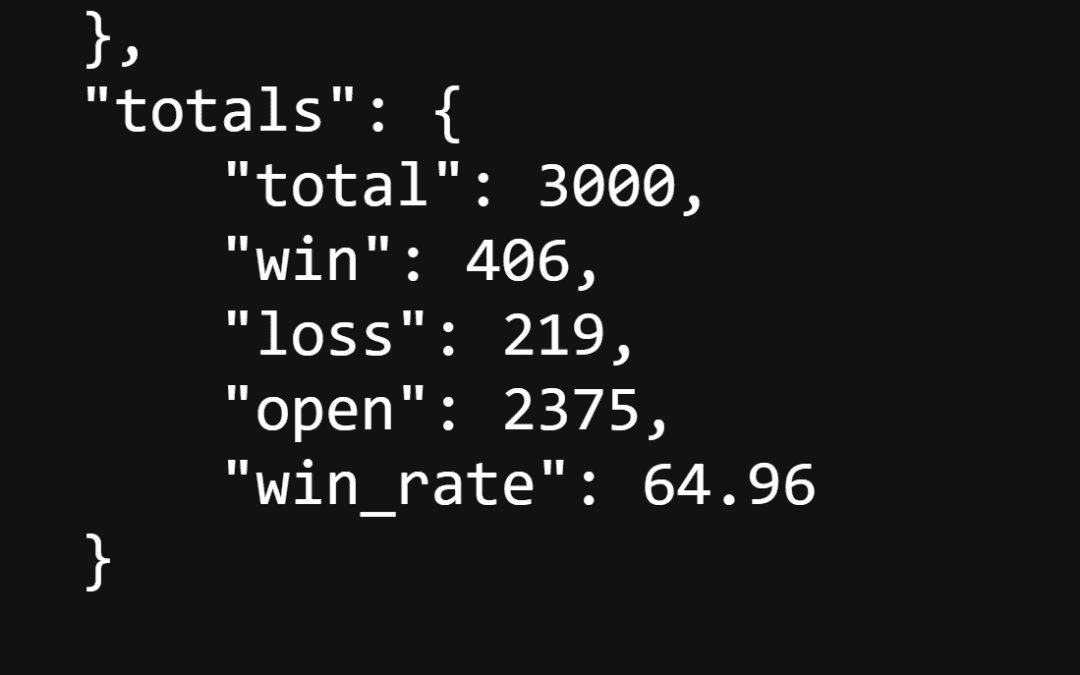
Across all assets and timeframes, the ASR strategy has executed a total of 3,000 trades, broken down as follows:
- ✅ 406 wins
- ❌ 219 losses
- ⏳ 2375 trades currently open
This translates into a win rate of 64.96%, which means that the majority of completed trades are closing in profit. For traders, that isn’t just a comforting figure – it’s statistical evidence of reliability.
For a mean-reversion system like ASR, such consistency is particularly significant. These strategies depend on identifying when prices have strayed too far from equilibrium, and their long-term viability rests on the assumption that markets will eventually revert to the mean. A win rate above 50% across thousands of trades shows that this principle is not only intact but holding strong across different assets, timeframes, and market conditions. It’s a clear validation that the strategy’s underlying logic is doing exactly what it was designed to do.
Standout Performers
Not all assets behave equally, and part of what makes ASR powerful is that it can adapt across instruments. Some highlights from the current data:
- NZDCHF (M30) – Out of 55 trades, 45 were winners, delivering a staggering 91.84% win rate.
- XPTUSD (Platinum, M30) – 40 trades, 36 winners, for a 94.74% win rate.
- XAGEUR (Silver/Euro, H1) – 43 trades, 31 winners, a solid 91.18% win rate.
- BTCUSD (Bitcoin, H1) – 31 trades, 22 winners, for a 70.97% win rate — showing ASR adapts well even to crypto volatility.
- AUDCAD (H1) – 10 trades, 9 winners, landing a 100% win rate so far.
These clusters of strong strategy performance highlight where the ASR strategy aligns particularly well with price behaviour and volatility.
Where the Market Pushes Back
Of course, no strategy wins everywhere. Certain pairs and timeframes have been more challenging:
- WTI Crude Oil (H1) – 30 trades, only 2 winners, resulting in a 6.67% win rate.
- US30 (M30) – 24 trades, just 1 winner, for a 4.76% win rate.
- EURCHF (H1) – 48 trades, with only 10 winners (29.41% win rate).
These results remind us that selectivity matters. Strategies like ASR are designed to be adaptable, but part of using them effectively is knowing where their statistical edge is strongest.
What This Means for Traders
The ASR results paint a nuanced picture of strategy performance across global markets. On the one hand, the data confirms a level of consistency and robustness that traders can rely on: with 2,574 trades analysed and a 58.55% overall win rate, the strategy demonstrates resilience across different conditions. This isn’t just a lucky streak on a handful of trades; it’s a large sample that underlines the statistical strength of the approach. At the same time, the results reveal an important truth that every trader should embrace, not all markets are equal. Certain assets and timeframes naturally align with ASR’s logic, producing outstanding results in instruments like NZDCHF, XPTUSD, and XAGEUR, while others, such as WTI and US30, present tougher environments.
This duality is what makes the analysis so valuable. By seeing both strengths and weaknesses clearly, traders are able to avoid overconfidence and instead refine their focus toward high-probability setups. The data doesn’t just measure past strategy performance, it builds discipline for the future, reminding us where patience pays off and where caution is necessary. Combined with sound risk management, these insights transform ASR from a black-box signal into a systematic decision-making tool. Rather than relying on guesswork or emotion, traders can lean on evidence, and that edge makes all the difference in the long run.
Final Thoughts
The data is unambiguous: the ASR strategy delivers. Its adaptability across asset classes is particularly striking, showing strength in currencies, precious metals, and even volatile markets like crypto. These high win rates confirm that ASR is not bound to a single niche but can flexibly adjust to different dynamics. At the same time, the results also highlight an essential caveat: market structure matters. Instruments such as WTI and US30, with their unique volatility profiles and macro sensitivities, proved to be more challenging environments, reminding us that no strategy is universally optimal.
For traders, this kind of transparency is invaluable. Knowing where a system thrives and where it struggles allows for smarter allocation of time and capital. Instead of treating signals as absolutes, traders can use ASR’s strategy performance data as a compass, pointing toward high-probability setups and away from markets where the edge is weaker. The outcome is a more disciplined, evidence-based approach to trading, one that replaces guesswork with clarity and confidence.
Thank you.