by admin | Jan 30, 2026 | Articles
After more than a decade relegated to the “wilderness” of the investment world, nuclear energy has abruptly reclaimed its seat at the table. This is not the result of a sudden romantic shift in public opinion, but rather a cold, hard collision with...
by admin | Jan 6, 2026 | Articles
In a historic strategic reversal, JPMorgan Chase has completely closed its notorious 200-million-ounce “naked” short position, which for over a decade was accused of suppressing silver prices through paper derivatives, and pivoted to amassing a massive...
by admin | Sep 2, 2025 | Articles
Are you passionate about trading the financial markets? How would you like to build long-term income, and work remotely representing a trusted trading software brand? Pipnotic has been building trading software and education since 2011, and has built a great brand as...
by admin | Sep 1, 2025 | Articles
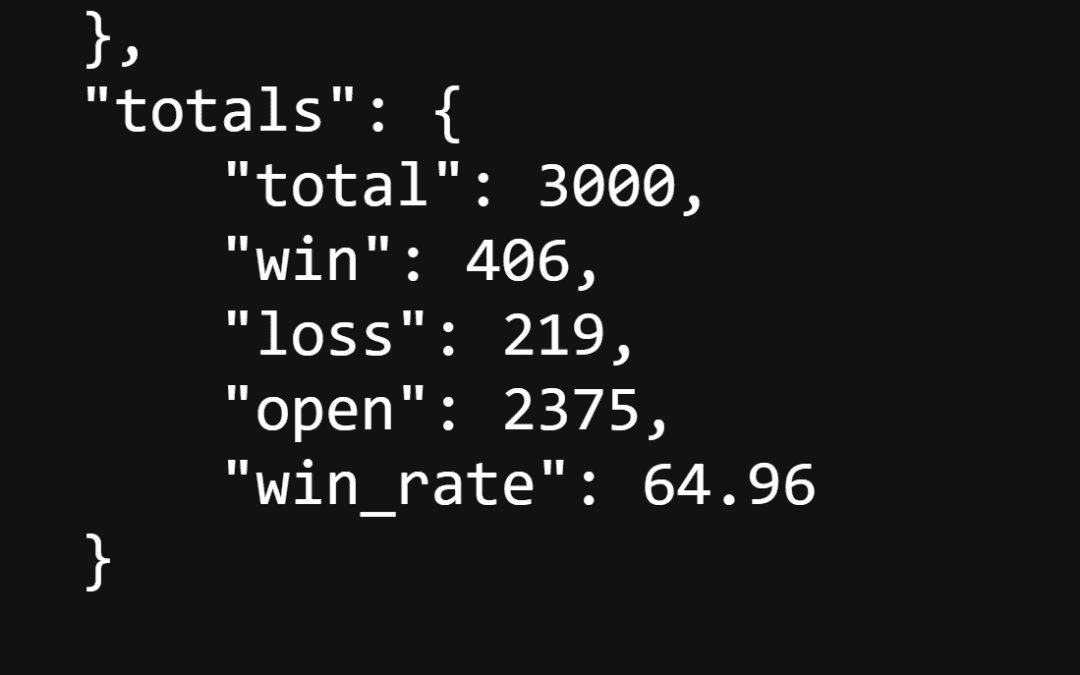
At Pipnotic, we believe in data-driven clarity. Trading isn’t just about intuition or gut feel, it’s about grounding strategies in evidence, so that decisions can be made with discipline rather than impulse, in order to measure strategy performance. The markets will...
by admin | Aug 24, 2025 | Articles
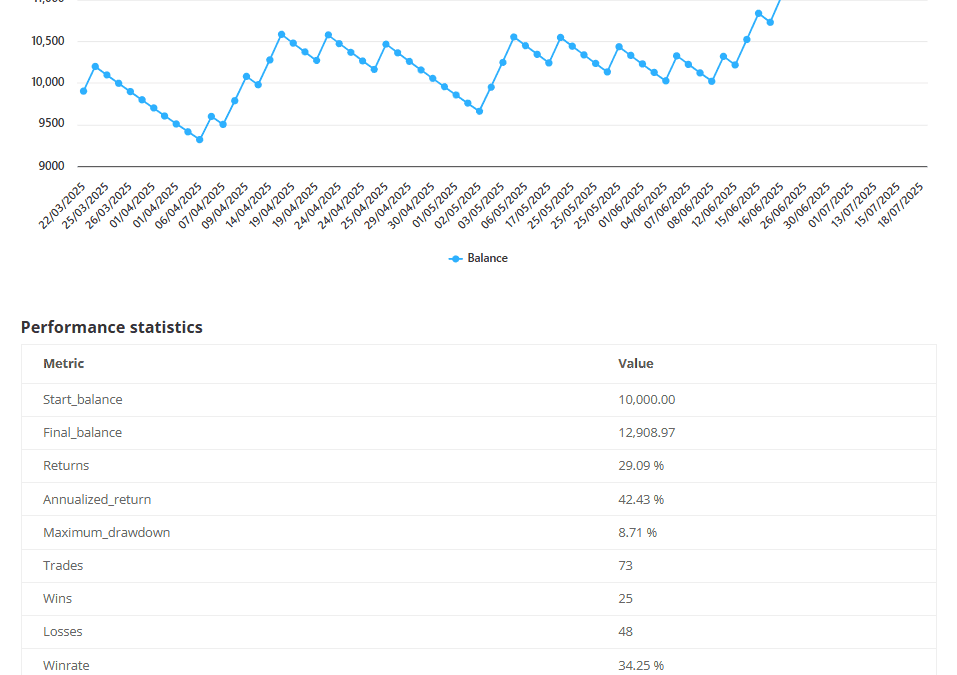
Over the past few months, I’ve been developing an optimizer for our back tester designed to uncover the most profitable combination of parameters for automated trading algorithms. The optimizer is essential because each asset and timeframe behaves differently,...
by admin | Jul 20, 2025 | Articles
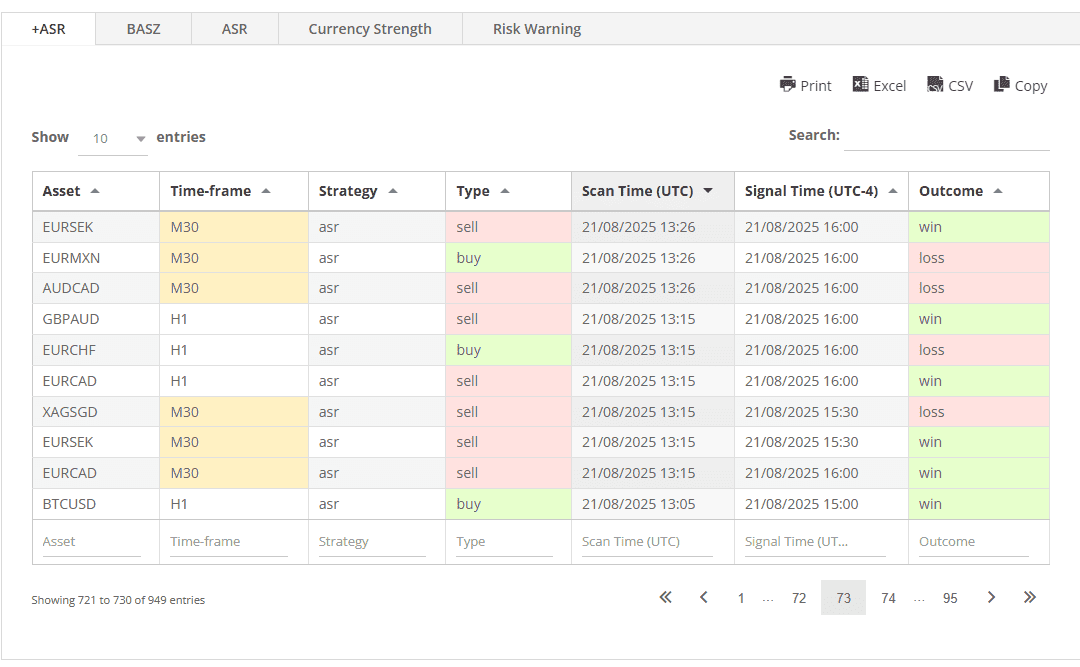
In trading, confidence often comes from repetition and clarity. When we understand not just what our strategies do but how they perform across different asset classes and market conditions, we gain the conviction to follow through with discipline. That’s why accurate...