I am super excited to introduce our new Trade Simulator, designed to help traders model, analyse, and better understand the dynamics of risk and reward in algorithmic and manual trading systems. This trade simulator allows users to input key assumptions such as win rate, reward-to-risk ratio, capital, leverage, and number of trades, and generates a simulated trading performance report, table of results, and a graph charting the results visually. This information is crucial when attempting to understand how profitable a system is – and most importantly, how efficiently risk is managed for a given trading system. This trade simulator was written in an attempt to better understand the relationship between key metrics, results, and risk.
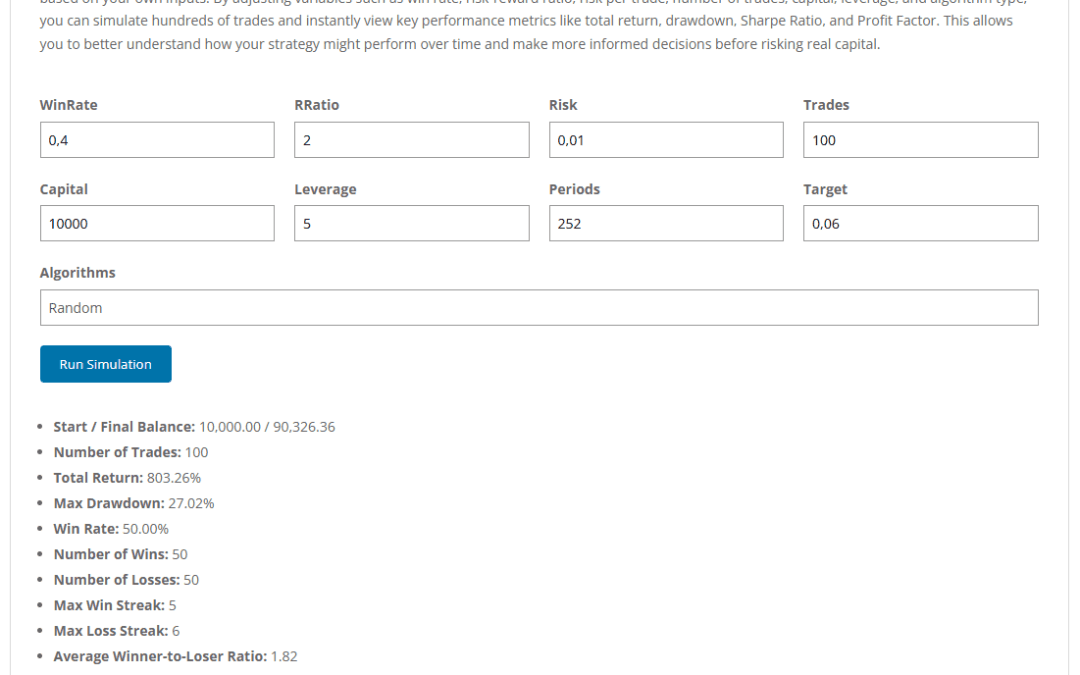
Here is an example of some results recently calculated using the trade simulator.

Trade Simulator Metrics
Rather than focusing on a particular simulation’s outcome, although I will provide one as an example in this article, this article dives deep into the metrics that the trade simulator outputs. Understanding these metrics is essential for evaluating the robustness and efficiency of any trading strategy.
Start / Final Balance
This is one of the most straightforward outputs of any trading simulator, this trade simulator included. It reflects the absolute performance of the strategy over the duration of the test by showing how much the account grew or shrank.
Start Balance: This is the initial capital allocated to the trading strategy. In a simulation, this serves as the baseline against which all future performance is measured. It can be adjusted to reflect different account sizes, helping traders understand how the strategy might perform under different capital constraints.
Final Balance: This is the total capital at the end of the simulation after all trades have been executed, including gains and losses. It includes both realized profits and the compounded effect of reinvested returns over time, assuming no capital was added or withdrawn during the period.
While these figures may appear to speak for themselves – especially if the final balance is significantly higher than the starting capital, they don’t offer a complete picture. A system that turns $10,000 into $100,000 may sound exceptional, but without knowing how much risk was taken to achieve that return, it’s impossible to evaluate the sustainability or reliability of the strategy.
Number of Trades
This metric defined in the trade simulator indicates the total number of trades executed during the simulation. It forms the foundation of any statistical or performance analysis and is essential for assessing the reliability and robustness of the trading strategy being tested.
In this simulation, the number of trades is 100, which is commonly viewed as the minimum threshold for drawing statistically meaningful conclusions. Here’s why this matters:
Why Sample Size Matters
In performance analysis, the law of large numbers tells us that as the number of observations (in this case, trades) increases, the observed average outcomes (e.g. win rate, return, drawdown) will converge closer to the strategy’s true long-term performance. When too few trades are used, random luck—both good and bad—can distort results. For example, a strategy might appear to be highly profitable over 10 or 20 trades purely due to chance, but may underperform drastically when exposed to more data.
Reducing Variance and Outliers
With a few trades, a single large win or loss can dramatically skew the results. For instance, one outlier trade could inflate the average return or disproportionately affect drawdown calculations. A larger dataset smooths out these anomalies, allowing metrics like the Sharpe Ratio, Profit Factor, and Calmar Ratio to better reflect the strategy’s typical behaviour rather than isolated events.
Balancing Trade Quantity with Strategy Type
The appropriate number of trades also depends on the type of strategy. For high-frequency or intraday strategies, hundreds or even thousands of trades may be necessary to validate effectiveness. For low-frequency or swing trading strategies, even 100 trades might span several years. In either case, the goal is to ensure that the sample captures a range of market conditions, including uptrends, downtrends, consolidations, and volatile periods.
Total Return
This metric shows the percentage gain or loss over the simulation period:
Formula:
Total Return = ((Final Balance - Start Balance) / Start Balance) * 100A total return of over 100% is impressive, but without knowing the risk taken to achieve it, it could be misleading. This is why we also consider drawdown and risk-adjusted ratios.
Max Drawdown (MDD)
Max Drawdown is a measure of peak-to-trough decline in the account balance, expressed as a percentage. It represents the worst-case loss scenario during the simulation period.
Formula:
MDD = (Peak Balance - Trough Balance after peak) / Peak BalanceIn the trading industry, a drawdown below 20–25% is generally considered acceptable for aggressive strategies, though lower is always better.
Drawdown helps answer:
How much pain would I have had to endure to achieve the return?
Win Rate
This metric measures the percentage of winning trades in the total sample.
Formula:
Win Rate = (Number of Wins / Total Trades) * 100The win rate represents the percentage of trades that closed in profit out of the total trades executed. In this simulation, the win rate is 50%, meaning half of the trades were winners. While this number alone might seem to suggest a coin-toss strategy, the win rate must always be interpreted in relation to other metrics—especially the reward-to-risk ratio, also known as the average winner-to-loser ratio.
Win Rate vs. Reward-to-Risk Trade-Off
There is a natural inverse relationship between win rate and reward-to-risk ratios in most trading systems:
A high win rate (typically above 60–70%) is usually achieved by strategies that take smaller, more frequent profits. These systems often rely on high-probability setups but may suffer disproportionately when losses do occur, especially if not tightly managed. Scalping strategies are a classic example – many small wins, but occasional large losses can negate progress.
A low-to-moderate win rate (often between 30% and 50%) can still be highly profitable if the average winning trade significantly outweighs the average losing trade. This is common in trend-following or breakout systems that aim to let profits run while cutting losses quickly. These systems may lose more often than they win, but the magnitude of the wins offsets the lower success frequency.
The trade simulator allows you to test different values and see how varying win rates and R-Ratios affect the results, which is a very fascinating activity, as you quickly realize that you don’t have to be right very often to earn money.
Statistical Context
The win rate by itself is not enough to evaluate profitability. A system with a 90% win rate that loses 10x the amount on each losing trade is not viable. Conversely, a system with a 40% win rate and a reward-to-risk ratio of 3:1 can be highly effective and robust over time. By setting a realistic win rate in the trade simulator, it is possible to modify the R-Ratio in an attempt to gain larger wins.
Number of Wins / Losses
These metrics provide a straightforward breakdown of how many trades were profitable versus unprofitable. In this case, 50 wins and 50 losses out of 100 trades confirm a 50% win rate. While this symmetry might seem ideal, the true significance depends on the relationship between average gains and losses. A 50% win rate can be highly profitable if the average winning trade is meaningfully larger than the average losing one.
Tracking the number of wins and losses also helps assess consistency and the distribution of outcomes across a strategy. It’s particularly important when combined with metrics like win streaks, drawdowns, and reward-to-risk ratios, offering a fuller picture of trading system stability and behavior.
These values are calculated by the trade simulator, and presented in the results above the data table.
Max Win Streak / Max Loss Streak
These streak metrics highlight the emotional and psychological dynamics of trading by tracking the longest series of wins or losses in a row, as they can have massive implications on an individuals mental state and thus ability to make decisions. A high max loss streak, even within a profitable system, can lead to hesitation, reduced position sizing, or abandoning the strategy prematurely. It’s a signal to evaluate how well the system handles adversity and whether risk controls (like position sizing or stop-losses) are sufficient to withstand these stretches.
Max win streaks, while encouraging, can sometimes foster overconfidence or lead to deviation from a disciplined trading plan. Though less concerning from a risk standpoint, they serve as a reminder to remain grounded and consistent, especially in discretionary systems where human behavior can skew decision-making after a run of success.
These values are also calculated by the trade simulator, and presented in the results above the data table.
Average Winner-to-Loser Ratio (Profit Factor)
This is the average profit per winning trade divided by the average loss per losing trade, and is calculated like so in the trade simulator:
Avg WL Ratio = Average Win / Average LossA ratio above 1.5 is typically acceptable; above 2.0 is considered strong. This means you make significantly more on your winners than you lose on your losers. When paired with a moderate win rate, this can form the backbone of a robust system.
Note: This metric is often labeled “Profit Factor” in trading literature, though some define Profit Factor slightly differently (total gross profits / total gross losses).
Leverage Applied
This shows how much leverage was applied in the simulation. Leverage increases both potential returns and potential losses.
For example, a leverage of 5 means that for every $1 of your own capital, $5 worth of trading power was used.
Industry professionals often monitor maximum drawdown closely when leverage is involved, as small market moves can produce exaggerated account changes.
Sharpe Ratio
The Sharpe Ratio is a risk-adjusted performance metric that compares the average return to the standard deviation of returns (volatility), and is calculated like so in the trade simulator:
Sharpe Ratio = Mean Return / Standard Deviation of ReturnsIt is typically annualized by multiplying by the square root of the number of trading periods (e.g., √252 for daily returns, which is the default in the trade simulator).
| Value | Rating |
| > 1.0 | Decent |
| > 2.0 | Very Good |
| > 3.0 | Excellent |
A Sharpe ratio of 5+ is exceptional but rare in live trading, and such values in simulation should be stress-tested across different market conditions. If you are seeing such values in the trade simulator then perhaps you should consider modifying the parameters until you reach something more realistic, such as the values presented in the table above.
Profit Ratio
In this trade simulator, the average winner-to-loser ratio – sometimes referred to as the Profit Factor in other contexts – measures the relative size of your average gain compared to your average loss. It’s calculated by dividing the average profit from winning trades by the average loss from losing trades (absolute value):
Average Winner-to-Loser Ratio = Avg. Win / Avg. LossFor example, a ratio of 1.82 means that, on average, your winning trades are 1.82 times larger than your losing trades.
Why It Matters
This metric provides a clear picture of your trade efficiency, how much reward you capture when you’re right versus how much you give up when you’re wrong. In practice:
| Value | Comment |
| < 1.0 | Losses are larger than your gains, typically unsustainable unless you have a very high win rate. |
| 1.0–1.5 | break-even or marginally profitable system, especially if paired with a high win rate. |
| 1.5–2.0 | Indicative of a well-balanced system that cuts losses quickly and lets profits run, a hallmark of strong risk management. |
Industry Perspective
Professional traders often target a profit factor – or average winner-to-loser ratio – between 1.5 and 2.5, though the ideal range varies by strategy type. This metric essentially reflects how much you gain on winning trades relative to how much you lose on losing trades, and it provides key insight into the balance between profitability and risk.
For example, trend-following strategies typically win less frequently (30–40% win rate) but make up for it with large wins when trends persist, leading to higher profit factors – sometimes well above 2.0. In contrast, mean reversion or scalping strategies often win more frequently (70%+), but with tighter margins and smaller payouts per trade. As a result, their profit factors tend to cluster around 1.0–1.2, relying on consistency rather than large wins to stay profitable. The trade simulator displays the profit ratio in the results.
Strategic Implications
This ratio can help validate a trading approach. For example, a strategy with a 50% win rate and a 1.82 average winner-to-loser ratio (as seen in this simulation) is considered structurally strong: each win is nearly twice the size of each loss, which means the strategy does not need to be right more than half the time to be profitable.
Calmar Ratio
The Calmar Ratio is a return-to-drawdown metric, calculated as:
Calmar Ratio = Annualized Return / Max DrawdownThe Calmar Ratio offers a clear picture of how efficiently a trading strategy converts risk into return by comparing the total return to the maximum drawdown. Unlike the Sharpe ratio, which considers both upside and downside volatility, the Calmar focuses solely on downside risk, making it particularly relevant for assessing the robustness of capital preservation during adverse market conditions.
A higher Calmar Ratio suggests that a system generates strong returns without experiencing deep drawdowns, which is especially valuable to investors seeking smoother equity curves. For context, a Calmar Ratio above 3 is generally considered excellent in professional trading circles, while values between 1 and 3 indicate solid, risk-conscious performance.
| Value | Quality |
| > 1.0 | Acceptable |
| > 3.0 | Excellent |
| > 5.0 | Rarely sustained in live markets and typically indicates an aggressive strategy or favourable simulation assumptions. |
Final Thoughts
This trade simulator was built to provide traders and strategy developers with more than just profit and loss feedback, as even trading systems with an incredibly high win rate of 99% can lose money. By focusing on industry-standard performance metrics like Sharpe, Calmar, Drawdown, and Win/Loss analytics, users can better understand the risk dynamics of their strategies and make more informed adjustments before putting real capital at risk. This also give traders some metrics to aim for when developing trading systems and models.
Whether you’re building automated systems or refining discretionary strategies, a deep understanding of performance metrics is essential for long-term trading success. These figures go far beyond surface-level profit—they reveal how well a strategy handles risk, adapts to volatility, and sustains performance over time. Investing time in learning how the trade simulator works – and what each metric means – will empower you to make more informed decisions, refine your strategy intelligently, and trade with greater confidence and discipline.
If you’re interested in taking the trade simulator for a spin, feel free to do so here.
Thank you.