The Commitments of Traders (COT) report is one of the most powerful yet often underutilized tools available to market participants seeking insight into futures market positioning. Published weekly by the U.S. Commodity Futures Trading Commission (CFTC), the Commitments of Traders report provides a detailed breakdown of the aggregate positions held by various classes of traders in the futures markets. For analysts, speculators, hedgers, and macro investors, understanding the COT can offer a significant edge in interpreting market sentiment and identifying potential turning points.
What Is the Commitments of Traders Report?
The Commitments of Traders report is a comprehensive summary of open interest held by different types of market participants across U.S. futures markets. Released every Friday at 3:30 p.m. Eastern Time, the report reflects data from the previous Tuesday. Despite this lag, the COT is widely regarded as an invaluable source of insight into how major traders are positioned across commodities, financial instruments, currencies, and indices.
The Commitments of Traders report is mandated by the CFTC to promote transparency in the derivatives markets. It categorizes traders based on their primary business activities, and the data is derived directly from registered futures commission merchants (FCMs), clearing members, and foreign brokers. These firms report their clients’ positions to the CFTC, which aggregates and anonymizes the data for public release.
How Is Commitments of Traders Data Collected?
Data for the Commitments of Traders report is collected through regulatory filings submitted by futures market participants. All reportable positions—those that exceed a certain threshold as defined by the CFTC—are recorded. The CFTC classifies traders based on these filings into groups such as:
- Commercial traders: Typically firms that use futures to hedge business-related risk.
- Non-commercial traders: Usually large institutional speculators such as hedge funds or asset managers.
- Nonreportable traders: Smaller participants who do not meet the reporting threshold.
The CFTC conducts a rigorous classification process based on the primary line of business of each trader. The categorization is not based on specific positions, but rather on the trader’s general purpose in the market.
What Information Is Provided in the COT Report?
The Commitments of Traders report provides granular data across various trader types. For each futures contract, the report includes:
- Long positions: The number of contracts held to benefit from a price increase.
- Short positions: The number of contracts held to benefit from a price decrease.
- Spreading positions: Used in the more detailed Disaggregated COT report.
- Net positions: The difference between long and short positions.
- Percentages: The proportion of total positions each group holds.
- Open interest: The total number of outstanding contracts for that instrument.
Depending on the version, the COT report may present data in the Legacy, Disaggregated, or Traders in Financial Futures format. The Disaggregated COT is especially useful, offering a deeper split of commercial and non-commercial activity into more specific subcategories.
How to Interpret Commitments of Traders Data
Understanding how to interpret the Commitments of Traders report is essential for using it effectively. Here are some common approaches:
Speculative Sentiment Analysis
Non-commercial traders are often viewed as speculative and trend-following. When this group is heavily net long or short, it may signal over exuberance and potential reversals. Extreme readings in either direction can suggest crowded trades.
Commercial Hedging Activity
Commercials are typically more informed and trade against speculative flows. A strong net long position by commercial traders may indicate that insiders see undervaluation, while heavy net shorts could reflect expected downside risk.
Changes Over Time
Rather than focusing on absolute levels, many analysts examine week-to-week changes in positions. A sudden shift in non-commercial positioning can precede significant market moves, especially when confirmed by price action.
Divergence Signals
When price trends diverge from positioning data in the Commitments of Traders, it may suggest an impending reversal. For example, if prices rise but net positions fall, it may reflect waning conviction.
Limitations of the Commitments of Traders Report
While powerful, the Commitments of Traders report is not without drawbacks:
- Time Lag: Because the data is released with a delay, it reflects positioning from three days prior.
- Data Aggregation: Reported positions are aggregated by category, making it difficult to distinguish intent behind trades.
- Focus on U.S. Markets: The report covers U.S. futures exchanges, leaving out important positioning on non-U.S. markets.
Despite these limitations, the Commitments of Traders report remains one of the few public datasets that provides insight into institutional trader behaviour.
A Comprehensive Tool for Market Analysis
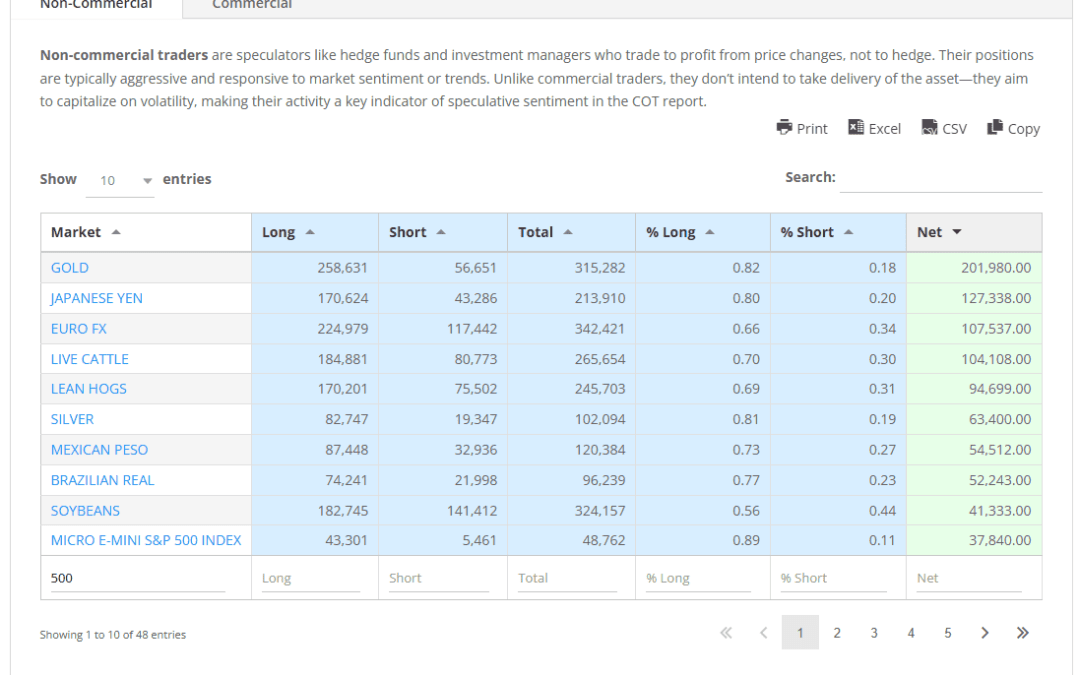
The Commitments of Traders (COT) Dashboard you’ve developed is a powerful and user-friendly tool designed to provide structured, actionable insights from weekly COT reports. Drawing on data published by the CFTC, this dashboard offers a dual perspective on trader positions – separated by Non-Commercial and Commercial categories – presented through clean, interactive tables. Here is an image illustrating the table presenting all markets:

Simply click on the market you’re interested in to view the development of key figures over time. Let’s explore how the dashboard works and the functionality it provides to analysts, traders, and researchers alike.
Overview of Dashboard Structure
The tabbed Interface makes it easy to view and analyse reports regarding Commercial vs. Non-Commercial participants, which makes performing an analysis very easy and fast. Simply click on the market of interest, and the market details are presented in the table below, Here is an image illustrating the development of the selected market data over time;

The Net column provides a clear snapshot of how long and short positions—both commercial and non-commercial—are evolving over time. This makes it easy to spot emerging trends or periods of stagnation at a glance.
Each market name in the overview table functions as an interactive link. Selecting a market instantly updates the detailed historical data below, allowing users to explore shifts in positioning specific to that asset. This intuitive interaction creates a smooth transition between high-level overview and in-depth analysis.
For users who wish to work with the data offline, the dashboard includes export options for Excel, CSV, and PDF formats, as well as a copy-to-clipboard feature—making it simple to incorporate insights into broader research or reporting workflows.
This layout is particularly effective for pinpointing areas of growing speculative interest or weakness across different asset classes, including currencies, commodities, and equity indices.
Conclusion
The Commitments of Traders report is a cornerstone of institutional market analysis. It provides deep insights into the behaviour of commercial hedgers and speculative traders, offering a lens into the forces driving market moves. By understanding how to interpret the Commitments of Traders data – and now, by using our interactive dashboard, you can track sentiment shifts, spot extremes, and refine your strategic decisions and even begin to identify metrics and variables for new trading models that leverage such information.
Whether you’re managing risk, trading momentum, or watching macro trends, incorporating Commitments of Traders data into your workflow can elevate your market intelligence. Our new dashboard gives you the tools to do just that—efficiently, intuitively, and with full transparency.
Thank you.