by admin | Jul 12, 2025 | Articles
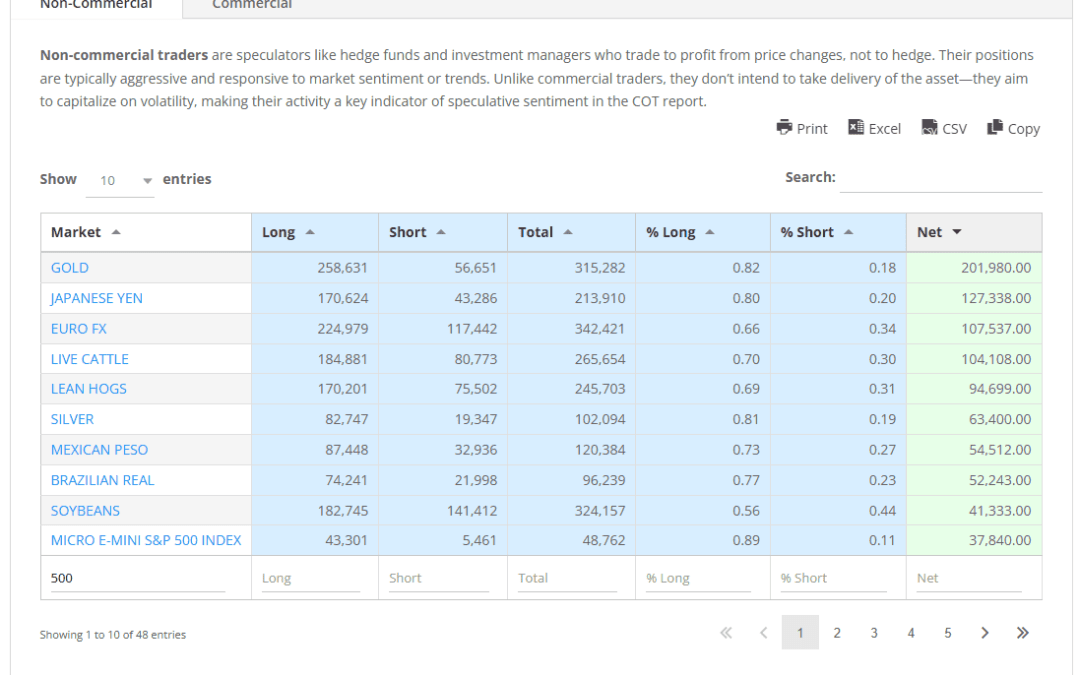
The Commitments of Traders (COT) report is one of the most powerful yet often underutilized tools available to market participants seeking insight into futures market positioning. Published weekly by the U.S. Commodity Futures Trading Commission (CFTC), the...
by admin | Jul 7, 2025 | Articles
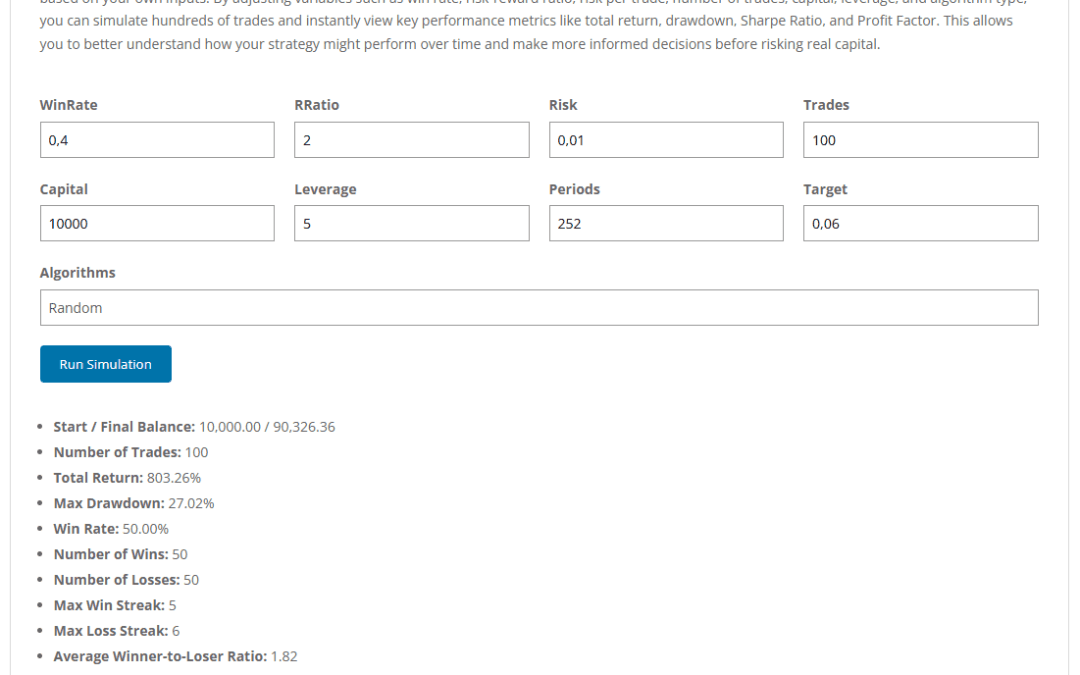
I am super excited to introduce our new Trade Simulator, designed to help traders model, analyse, and better understand the dynamics of risk and reward in algorithmic and manual trading systems. This trade simulator allows users to input key assumptions such as win...
by admin | Jun 24, 2025 | Articles
Two Months with the ASR Expert Advisor – A Promising Start I wrote about the ASR Expert Advisor (EA) after the first month of using it, I am impressed by its ability to consistently identify high-quality trade opportunities and manage positions with impressive...
by admin | Jun 16, 2025 | Articles
Every trader dreams of consistent profits, but the path to achieving them is rarely straightforward. It’s often paved with uncertainty and the constant tension between risk and reward, and Trade Probability. However, the most successful traders understand that...
by admin | Jun 13, 2025 | Articles
In the fast-paced world of stock market speculation, every edge counts. What if you could gain insight into the genuine sentiment of those who know a company best? That’s precisely what SEC insider trading data offers – a window into the actions of a...
by admin | Jun 11, 2025 | Articles
In this article, I will attempt to paint a vivid picture of a market teetering on the edge, perhaps a looming market crash, with weekly supply zones acting as ominous barriers that could trigger significant sell-offs. It suggests a potential bull trap and market...