Over the past few months, I’ve been developing an optimizer for our back tester designed to uncover the most profitable combination of parameters for automated trading algorithms. The optimizer is essential because each asset and timeframe behaves differently, requiring tailored configurations rather than a one-size-fits-all approach. For example, the way OIL moves on a 30-minute chart is completely different from how GBPJPY behaves on a 4-hour chart, making it clear that using identical settings would be ineffective. As I mentioned in a previous article on creating a profitable trading system, parameter optimization is not just a refinement but a critical layer that transforms a strategy from theoretical into truly robust.
What does this mean?
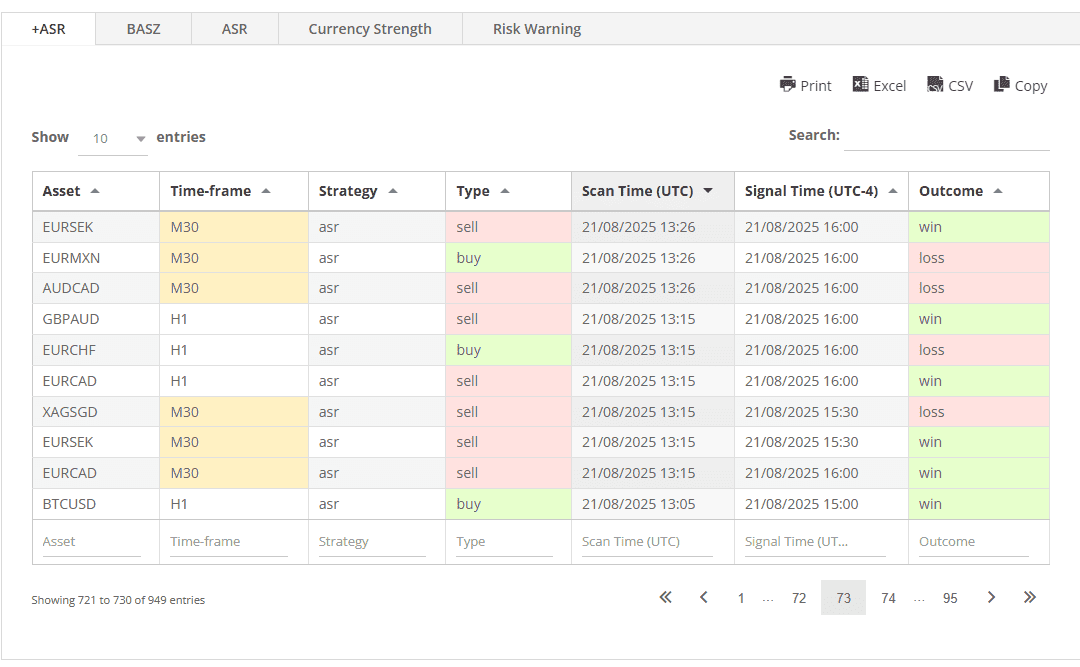
Each day, as new data is downloaded, the optimizer I developed automatically runs to identify the most profitable combination of parameter settings for every asset we track. This ensures that every notification in the +ASR table is backed by the most advantageous and profitable configuration. Since some assets are highly volatile while others are more stable, the optimizer makes it possible for our algorithms to adapt intelligently, setting parameters that closely match the unique behaviour of each underlying asset rather than applying a generic, less effective approach.
Here is an example of the dashboard:

At present, the optimizer is running on the +ASR algorithm, with all parameters optimized once per day for each tracked asset. Every parameter is passed through the optimization process daily, and the most profitable set of values is identified, combined, and stored in a database. This optimized parameter set is then used to qualify new notifications with greater accuracy and reliability. In the near future, the same optimizer framework will also be applied to the +BASZ algorithm, which will be available through the same dashboard once development is finalized.
Let’s see some statistics
I am continuously collecting data for each asset in our watch list so that a more in-depth analysis of the optimizer can be performed as the sample size grows. This expanding dataset allows the optimizer to deliver increasingly reliable insights over time. Let’s have a closer look at some of the key takeaways from the optimizer results we’ve observed so far.
Precious metals on 1-hour
- XAGUSD H1: 15/15 wins (100%) – excellent sample and consistency.
- XAGEUR H1: 7/7 (100%)
- XAGAUD H1: 9/9 (100%)
- XAUSGD H1: 6/6 (100%)
- XAUEUR H1 / XAUAUD H1 – clean sweeps on smaller samples too.
Platinum & Forex on 30-minute
- XPTUSD M30: 16/16 closed wins (100%) with 2 still open – stellar.
- EURCAD: Perfect across all seen TFs – M30 (5/5), H1 (4/4), H4 (1/1).
- NZDCHF M30: 12/12 (100%) with 3 open.
- USDZAR: M30 (7/7) and H1 (2/2) both spotless.
- AUDCAD H1: 7/7 (100%); M30 also positive with 51.61% over 31 closed.
- AUDSGD: H1 (3/3, 100%) and M30 (6/7, 85.71%).
- EURSGD M30: 20/33 closed (60.61%) – nice with a bigger sample.
- USDNOK M30: 14/26 (53.85%) – solid with volume.
Indices
- UK100: M30 (6/6, 100%), H1 (3/3, 100%) – very clean.
- JP225 M30: 7/7 closed wins (100%), 1 open.
Crypto
- BCHUSD M30: 10/10 closed wins (100%), 3 open.
- BTCUSD H1: 5/6 closed wins (83.33%), 9 open.
- LTCUSD M30: 9/11 closed wins (81.82%), 2 open.
- ETHUSD M30: 1/1 (100%) (tiny sample, but green).
Timeframe takeaways
Current optimizer results highlight particularly strong performance on the H1 timeframe for several metals and FX pairs, including XAGUSD, XAUUSD, EURCAD, AUDCAD, and USDZAR. On the M30 timeframe, multiple high-conviction opportunities are emerging, such as XPTUSD, NZDCHF, UK100, BCHUSD, and AUDSGD, alongside solid breadth across assets like AUDCAD, EURSGD, and USDNOK.
Looking ahead, the key strategy is to continue allocating into the highest-performing asset/timeframe combinations identified by the optimizer: XAGUSD H1, XAGEUR H1, XAGAUD H1, XPTUSD M30, EURCAD (M30/H1), NZDCHF M30, USDZAR (M30/H1), UK100 (M30/H1), AUDCAD H1, BCHUSD M30, BTCUSD H1, LTCUSD M30, and AUDSGD (M30/H1). As sample sizes expand across all sets, the optimizer will provide increasingly clear insights into durable patterns across key markets and timeframes, enhancing the reliability of long-term strategy allocation.
Final notes
A few pockets remain under review, such as GBPMXN on H1, certain USD cross pairs on H1/M30, and select crypto assets on M30, and these will require ongoing monitoring until sample sizes are large enough to confirm consistency. With 260 trades still open, the optimizer results can continue to evolve, leaving plenty of upside potential as these positions resolve.
Even with more data needed, it’s already clear that multiple A-tier, repeatable edges are emerging: metals on H1, select FX pairs on H1/M30, key indices, and a handful of crypto markets. The path forward is straightforward: scale what’s already working, expand sample sizes where win rates exceed 80% to validate durability, and prune or refine filters in weaker areas. This is precisely where the optimizer and the supporting statistics database become invaluable, ensuring that profitable configurations are reinforced while weaker setups are systematically improved. It’s an exciting stage of the project, one that continues to reveal the strength of structured optimization in trading.
Thank you.